Even though writing my monthly income reports isn’t a major driver of traffic to my blog (yet), I’ve been inspired to learn more and more about what drives traffic to my blog from the monthly reports of others. Specifically, Bjork Ostrom from Pinch of Yum and Pat Flynn from Smart Passive Income. Their dedication and transparency in providing detailed reports about blog income have inspired me to continue to grow my own blog. A “shout-out” to both of them – thanks, guys! You rock!
Anyway, in learning about how traffic lands on my blog, I’ve struggled to learn how to use Google Analytics. What I have learned about Google Analytics is a direct result of reading Bjork’s monthly income reports, which I’ve read since March of 2012. Bjork and his wife, Lindsay, have been food bloggers for a little over 4 years. Bjork started writing his monthly income reports in September 2011, when he reported income of $21.97.
To put this into perspective, in his most current monthly income report for May 2014, he reported income of $23,378.49!!! In 33 months, they’ve gone from virtually nothing to +$20,000 a month!
Congratulations to Lindsay and Bjork, who announced a couple of weeks ago that they are “retiring” from their full-time jobs working for others and will solely work for themselves in the blogging arena.
Since I’ve struggled to learn the nuances of Google Analytics’ technical mumbo-jumbo, I’m sure other bloggers do too! So, I’ve decided to share the little bit I’ve learned with my readers, just in case they, too, want to learn more about Google Analytics and it’s importance to bloggers.
So, I’ve written a 5-part series about the basics of Google Analytics that I’m launching all this week. Therefore, if readers are, indeed, interested in learning more, they don’t have to wait for the next edition because they will all be released consecutively over the next 5 days. Google Analytics: The Basics is the first post in this 5-part series. The other four are:
- Google Analytics: A Peek into Reports
- Google Analytics: The Audience Report
- Google Analytics: The Acquisition Report
- Google Analytics: The Behavior Report
These 5 posts are meant to provide readers with an overview and basic understanding of how to read, understand and analyze these reports to improve your blog. While I still have a long way to go to reach the stratospheric numbers of Pinch of Yum and Smart Passive Income, in 10 months time this itty, bitty blog went from “lucky to have 40 visitors a day” (thanks, friends and family!) to an average of 340 visitors a day! And, I believe this growth is because I’ve learned to understand what drives traffic and have worked to make improvements!
Talking numbers can be a very “dry” and dull subject. I personally find the analysis process of what drives traffic to my blog fascinating. You see, I want people to land on my site and stay awhile! As bloggers and creative people, don’t we all want to have readers visit us, stay awhile and come back again?
While I don’t spend every single day analyzing my traffic numbers, I do analyze them once a month and write a monthly income report update for this blog. My intent on doing this is two-fold:
- to share my blog’s growing journey with readers and
- to help newer bloggers find their way in the jungle that is the blogging experience!
If you’ve missed any of my monthly income reports, now’s your chance to get caught up! Here’s a link to the most current Monthly Income Report – May 2014, which provides links to other past monthly income reports.
So, what’s Google Analytics all about and why should bloggers care? Let’s start with a few basic assumptions about bloggers. There are many reasons that people start blogs:
- personal on-line journal for family and friends
- business website with a blog meant to attract and keep customers
- blog connected to an Etsy store to attract and keep customers
- a blog with a particular focus based on a hobby or interest, such as crafting, cooking, fashion, etc.
But, if a blogger has created a blog that IS their business or a sideline to their main business (for example, an Etsy shop or a service provider, such as a graphics design company), it is important to understand what drives traffic to their site. Without traffic, a blog doesn’t grow or provide opportunities for new streams of revenue that only traffic can bring.
This post is the first in a series meant to help the new or newer blogger understand the importance of analyzing their Google Analytics account. This post makes the following assumptions about you, the reader of this post:
- The reader has a blog
- The reader’s blog is a business
- The reader has installed Google Analytics
- The reader has limited experience in using Google Analytics
Google Analytics is a robust service provided by Google for free. Yes, that’s right; it costs nothing! And, the information available at the blogger’s fingertips is so diverse, that I’ve only scratched the surface of how I can use their tools to continue our blog’s upward climb in the rankings.
Google Analytics is aimed toward “marketers” as opposed to “webmasters” so you don’t need to have a technical background or know HTML to benefit from learning what drives your traffic. And, yes, you are a “marketer” if you have a blog! You are constantly marketing your blog whether you realize it or not!
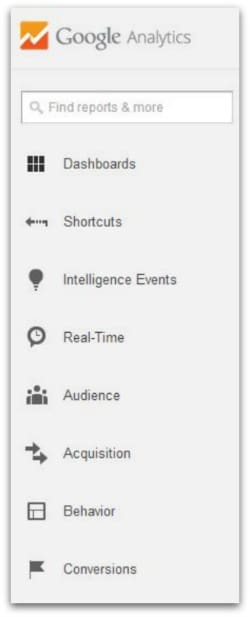
When you first log on to Google Analytics, on the left side of your screen you will notice a sidebar that lists available options. Here’s a picture:

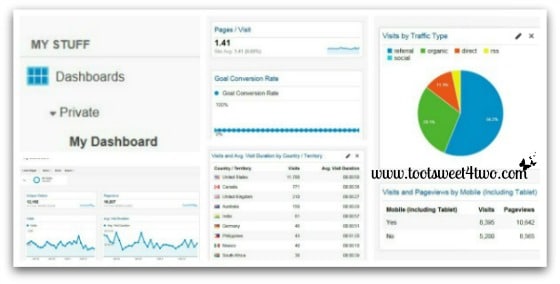
When you click on Dashboard in the sidebar navigation area, it drops down to reveal “Private” and “New Dashboard”. “Private” further reveals a drop down called “My Dashboard.” Let’s take a look at my Dashboard:

Because I’m not able to give you a snapshot of the entire Dashboard, the above photo was put together in PicMonkey as a collage to show you the main areas of the Dashboard. When you are viewing your Dashboard on your screen, the various areas will be in a slightly different order. But, my PicMonkey collage still shows you the key areas of importance to review:
- Unique Visitors – total number of unique visitors to your site
- Pageviews – total number of pages viewed on your site
- Pages / Visit – pages per visit is the average number of pages viewed per visit
- Visits by Traffic Type – tells you where your traffic came from whether referral, organic, direct, rss, social
- Visits and Pageviews by Mobile (including Tablets) – tells you whether readers are accessing your site from a desktop or a mobile device
- Visits and Avg Visit Duration by Country / Territory – self-explanatory
- Goal Conversion Rate – an available tool I have yet to activate {grin}
We will discuss the importance of each of these in upcoming posts, but for now I just want you to see what is available under “My Dashboard.”
The next available report in the sidebar navigational area is “Shortcuts.” “Shortcuts” is a user-defined area, so I will let you explore that part on your own as you become more familiar with Google Analytics.
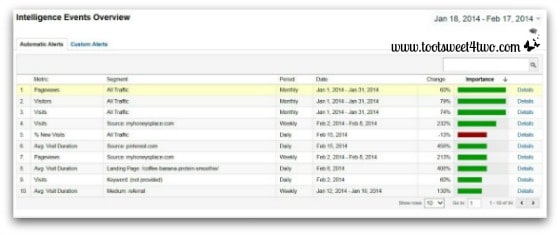
The next available report, “Intelligence Events”, pictured below, is a quick overview of how your traffic has changed over the preceding 30-day time period. When you click on “Intelligence Reports,” a drop-down menu appears with these additional choices:
- Overview
- Daily Events
- Weekly Events
- Monthly Events

You can see from the Intelligence Events Overview that our blog is down 13% in New Visits from All Traffic sources. While I might, initially, worry and fret and try to figure out why our traffic is down from all traffic sources, note two things:
- this is a “Daily” report, so we are down 13% over the preceding day and
- we have increased in all other areas of this report by huge percentages! Talk about motivating!
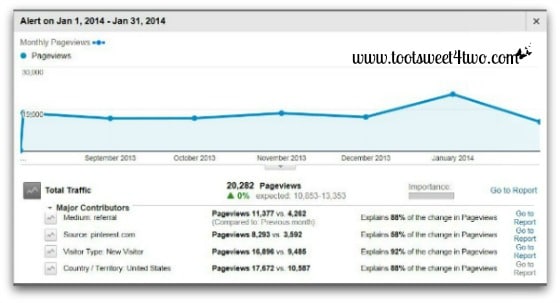
When you click the word “Details” to the right of each of these parts of the Automatic Alerts of the Intelligence Events Overview, you will see the following report:

This report tells me the changes in our Pageviews from the previous month. In our case, our Pageviews are on a positive upward climb! That’s the thing about analyzing your Google Analytics account…it’s a huge motivational tool and as you see your traffic and readership grow, you’ll use the information provided by this resource to make your blog and business better and better!
Stay tuned for the rest of the series…
- Google Analytics: A Peek into Reports
- Google Analytics: Analyzing and Understanding the Audience Report
- Google Analytics: Analyzing and Understanding the Acquisition Report
- Google Analytics: Analyzing and Understanding the Behavior Report
Tootles,

Related Posts:
(other blogging tools and tutorials)
- 3 Cheap and Easy Ideas for Better Food Photography
- 10 Ways to Improve Your Blog’s Design
- How Did You Do That? A PicMonkey Halloween Tutorial
- How to Add a Featured Image Thumbnail to a WP Post
- How to Make a Horizontal Photo a Pinterest-friendly Vertical Photo Using PicMonkey
- We Heart the Snipping Tool
Leave a Reply