
Welcome to the fourth post in my 5-part series about analyzing, understanding and utilizing the basics of Google Analytics. If you missed the first four posts in this series, now’s your chance to catch up by clicking these links:
- Google Analytics: The Basics
- Google Analytics: A Peek into Reports
- Google Analytics: Analyzing and Understanding the Audience Report
- Google Analytics: Analyzing and Understanding the Acquisition Report
Google Analytics is a robust data aggregation service provided by Google for free. If you want to monetize your blog, Google Analytics is a necessary tool to install on your blog. While there are many other analytical tools out on the web that capture your blog’s traffic numbers, Google Analytics is the most “accepted” source of truth by advertisers, sponsors, marketers, etc. And, Google Analytics is, more often than not, the report that social media agencies want installed if you join their network of bloggers.
This post makes the following assumptions about you, the reader:
- The reader has a blog
- The reader’s blog is a business
- The reader has installed Google Analytics
- The reader has limited experience in using Google Analytics
When you first log in to Google Analytics, the left side of your screen is a navigation sidebar with drop-down menus. We have covered several of those navigation aids in the first four parts of this series and this post focuses on the Behavior report.
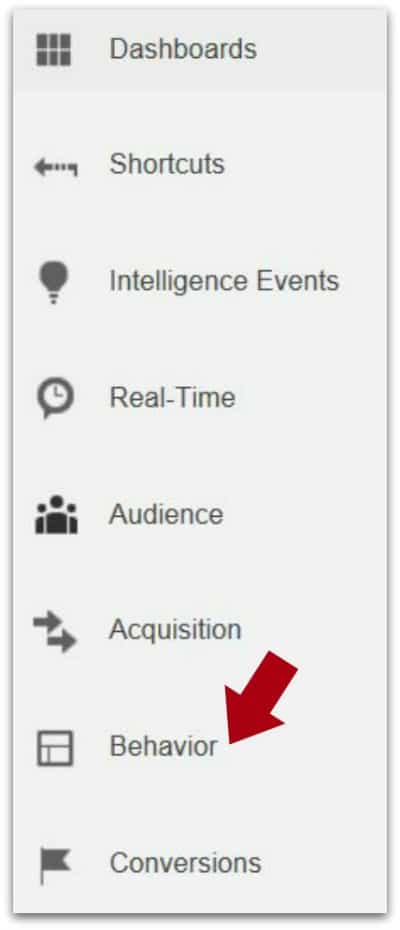
When you click on Behavior, additional drop-down menu choices appear. They are:
- Overview
- Behavior Flow
- Site Content
- Site Speed
- Events
- AdSense
- Experiments
- In-Page Analytics
Several of these menu tabs (Site Content, Site Speed, Events and AdSense) have additional drop-down menus. So, as with all the other sidebar navigation tools, the Behavior reports are extremely robust, providing numerous ways to display data. In addition, several of these reports require that you:
- customize them by either installing Webmaster Tools
- add code to your website/blog
- create parameters to track data.
Since this series is meant to cover the “basics”, in this post we will focus on only the tools that are available with no extra customization.
Behavior Overview
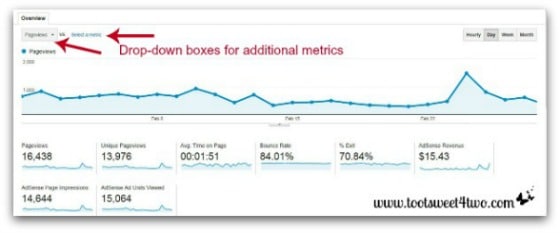
In the photo above, you are seeing only the top half of the page. I couldn’t provide a screen shot of the entire page because the second half of the page is below the fold! Note that I’ve added red arrows to point to the additional drop-down capability of this report. By clicking on the drop-down, additional choices are offered for viewing information.
the Behavior Overview gives you some of the same information available in other reports, but adds information about Google AdSense. This information will appear if:
- you have applied to Google AdSense
- have been accepted by Google AdSense
- and have Google advertising installed on your blog.
As I suggested earlier above in this post, I recommend that as soon as your blog meets Google AdSense’s qualifications that you apply to Google AdSense (currently, one of the requirements is that you need to have your website/blog up-and-running for 6 months). You never know when your stars will align and a post go viral!
Behavior Flow
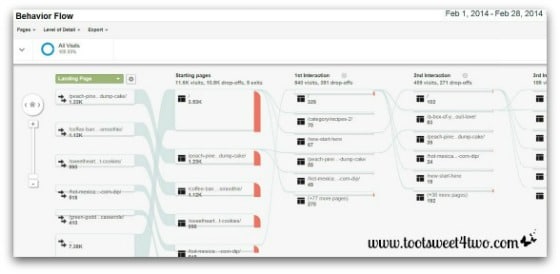
This is a fun graph to review. It shows you what your visitors landed on and where they went next. When you hover over each connecting line, more information specific to that event appears. Also note at the top left, Landing Pages, is a drop-down arrow allowing you to further define the information you want to retrieve.
Site Content – All Pages
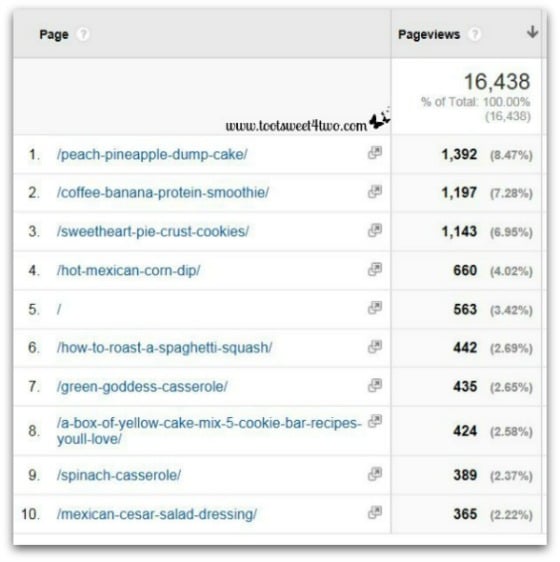
I love this report. Next to seeing the number of visits, unique visitors and pageviews, this is my personal favorite report! Why? Because it tells me what posts have been “popular.” By the way, you are not seeing the entire page; just a snippet. Again, that’s because I couldn’t screen shot the entire page! But, this photo shows the important information (at least in my opinion).
If you read my earlier posts, you will note that we had a traffic spike on February 24th from being featured in a newsletter from a recipe content aggregation site. The newsletter featured a link to our Peach Pineapple Dump Cake recipe and traffic followed!
Two of our other recipes had good representation. Here are my theories on those two posts:
Coffee Banana Protein Smoothie
The traffic generated by my Coffee Banana Protein Smoothie post was probably because it’s the beginning of a new year and people are into their New Year’s Resolutions (weight loss or healthy eating or both). This post launched on my site on July 3, 2013, so it is not a new post. By analyzing this data, I’ve concluded that this post performs well at the beginning of the year, so I should share this on all social networks during the first quarter of the year. By the way, I didn’t do anything with this post this year. It just happened. So, now I have a new strategy to implement next year.
Sweetheart Pie Crust Cookies
The traffic generated because of my Sweetheart Pie Crust Cookies post is a “no brainer” in that we can conclude it was because of Valentine’s Day. This information tells me that holiday posts are popular and going forward, I should incorporate more holiday posts into our schedule. Maybe start them sooner, rather than later. I have a hard time ramping up for holidays before they happen {grin}!
Also, in the photo, you are seeing the top 10. You can expand this view at the bottom of the page to see all of your posts. I did this and noticed that people have landed on my site to see/read posts at respects St. Patrick’s Day from last year. If I’d been more “forward thinking”, I’d have new St. Patrick’s Day posts ready on my site on St. Patrick’s Day well in advance of the holiday. Holidays rock!
I don’t know why #4 in the report above is blank. Have not yet figured that out {grin}! Because the rest of the report, which is several pages long, is very specific showing the numbers for specific landing pages. If any reader knows the answer, please share in the comments section so that we all learn!
Google AdSense
Finally, below is the report reflecting my Google AdSense revenue for the month of February. While this is a paltry sum, it is more than I had this time last year! So, I encourage readers who qualify, but have not yet applied to Google AdSense, to do so.
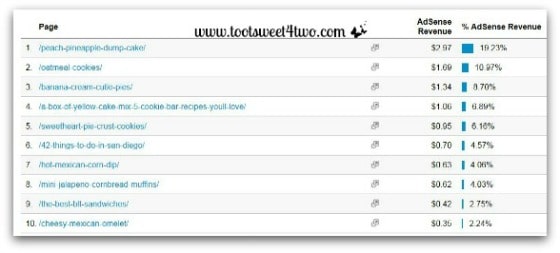
Revenue generated from ad placement on your site will only increase over time as your traffic increases. So, why wait until you have major traffic? Do it now and get the benefit even if your traffic numbers are small. Every little bit helps…
Thanks for following the series! My hope is that this series brought value to bloggers interested in learning more about Google Analytics.
Tootles,

Related Posts:
(other posts about blogging)
- 2 Girls with an Idea
- 3 Cheap and Easy Ideas for Better Food Photography
- 10 Ways to Improve Your Blog’s Design
- 17 Girls and a Baby
- 1000 Hats
- A Fresh Start on a Budget
- Bloggy Boot Camp Revealed
- Breaking the Rules
- Here Comes Peter Cottontail – A PicMonkey Tutorial
- How Did You Do That? A PicMonkey Halloween Tutorial
- How to Add a Featured Image Thumbnail to a WP Post
- How to Make a Horizontal Photo a Pinterest-friendly Vertical Photo using PicMonkey
- Is She the World’s Youngest Blogger?
- Liebster Blog Award
- Millennial Blogs: An Interview with Chelsea Day
- New Year, New View
- Nothing Ventured, Nothing Gained
- Really? Seriously? Are You Frickin’ Kidding Me?
- Someday I’ll Learn
- The Baker’s Hat and Other Musings
- The Conference Hangover
- Toot Sweet for Two Turns One: Blog-o-versary Party Recap
- Top 10 Reasons Why I Love Bloggy Boot Camp
- Under Construction
- Viva Las Vegas
- We Heart the Snipping Tool
Leave a Reply