
Google Analytics: A Peek into Reports is the second post in my 5-part series about utilizing, understanding and analyzing the basics of Google Analytics. If you missed the first post in this series, you can catch up now by clicking this link – Google Analytics: The Basics.
In yesterday’s report, I shared a little bit of information about the two blogs that have inspired me to write my monthly income reports. These two guys and a girl, Bjork and Lindsay Ostrom from Pinch of Yum and Pat Flynn from Smart Passive Income, have taken their blogs to stratospheric heights in both traffic and income. Yesterday, I focused a little on Bjork and Lindsay, since their blog was the very first monthly income report I ever read back in 2012. So, today I’ll focus just a little on Pat Flynn.
Pat was an architect with a 9 to 5 job working for others. In 2008, in got laid off. Prior to his lay-off, he was studying for the LEED exam and decided to put his study/course into a WordPress blog. So, when the lay-off happened in June 2008, he was already working on his website/blog and learning how to monetize it. Pat tells his story so much better than I’m able to and you can read his story here: The History of My First Online Business.
In his first monthly income report, which he published in October 2008, he reported income of $7,906.55. In his most recent monthly income report, April 2014, he reported income of $89,422.44. In 5 and half years time (and countless hours of hard work), Pat’s online income skyrocketed. It is important to note that these numbers are gross numbers; most of his monthly income reports include net income reports, too. You can read all his monthly income reports here: Pat Flynn’s Income Reports.
I’m sharing their amazing stories because it is possible to make money online, but it takes perseverance, dedication and hard work.
How do their stories relate to Google Analytics and why is it important that a blogger understand Google Analytics? Well, it’s not important, if you are blogging for your own personal enjoyment. Your family and friends will still follow you plus you may acquire unknown followers who are either intrigued by your content, your voice or just find your blog an interesting and enjoyable place to visit.
But, if you have a blog that is your stand-alone business or attached to a business website, understanding what drives traffic to your site is the holy grail. Because without traffic, a blog and/or business doesn’t grow and succeed but withers on the proverbial vine that is the world wide web!
This post makes the following assumptions about you, the reader:
- The reader has a blog
- The reader’s blog is a business
- The reader has installed Google Analytics
- The reader has limited experience in using Google Analytics
When you first log on to Google Analytics, the left side of your screen is a navigation sidebar with drop-down menus.
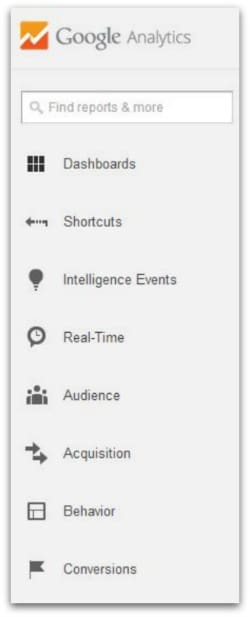
We covered “Dashboards,” “Shortcuts” and “Intelligence Events” in my first post, Google Analytics: The Basics. If you missed that post, take a moment and read it now; I’ll wait for you {grin}!
In addition to these 3 reports, the sidebar navigation includes these other reports:
- Real-Time
- Audience
- Acquisition
- Behavior
- Conversions
Each of these separate areas is quite robust in their own standing, with multiple opportunities to “slice-and-dice” information in just about any configuration the blogger needs. When you click on each of these main headings on your sidebar navigation, additional drop-down menus appear giving you choices on how to view this information. With the exception of “Real-Time” and “Conversions,” we will cover each of these reports in more depth in upcoming posts in this series.
The “Conversions” area is quite detailed, too, and requires that you establish “goals” in order to utilize these reports. Briefly, goals are targeted objectives that you establish for your blog, such as “Subscribe to My Newsletter! Enter Your Email Address Here!”
By setting “goals” for targeted objectives, you can analyze the information gathered to determine your next course of action. If you are interested in using this feature, click on the “Learn More” hyperlink under the “Conversions – Goals – Overview” section.
In the meantime, here’s a brief overview of Real-Time, Audience, Acquisition and Behavior.
Real-Time
The Real-Time Report is so much fun to watch! In “real-time”, bloggers can see how many people have accessed their site and what they are viewing. At the time I took this snapshot of my dashboard in Google Analytics Real-Time Reports, I had 15 people visiting my site, most of them from All Free Casserole Recipes, a recipe content aggregation site. And, as you can see from that report below, our visitors were viewing specific recipes!
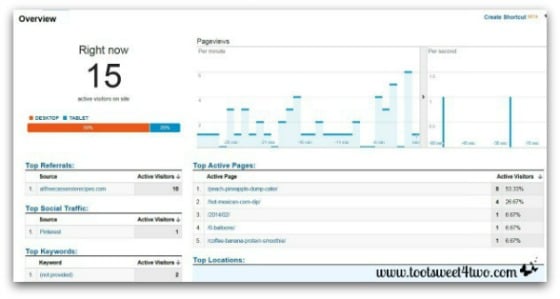
Each of the menu tabs under Real-Time give you more detailed information: Overview, Locations, Traffic Sources, Content.
Audience
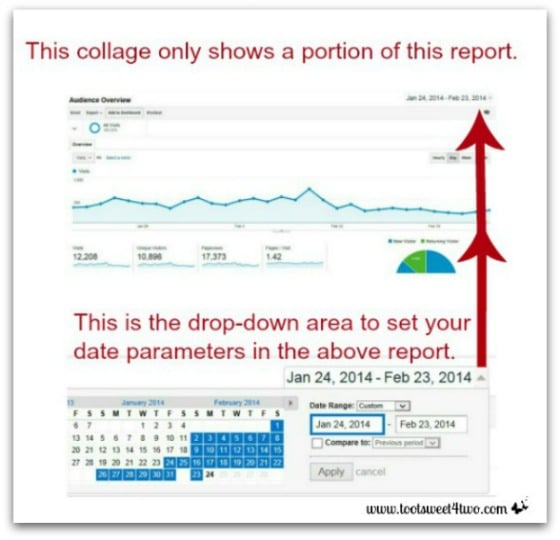
The Audience Overview Report gives the blogger oodles of information in one quick glance. And, it allows you to change the date to show a report daily, weekly, bi-weekly, monthly, annual – whatever date parameter the blogger needs.
How is changing this date useful? One example: if the blogger launches a sponsored post for a client, the blogger can analyze how much traffic the blog received on the date of launch or any date after.
At a glance, the report provides a graph of traffic over the specified time period, a pie chart to show the percentage of new versus returning visitors, plus specific numbers for the following:
- Visits
- Unique Visitors
- Pageviews
- Pages per Visit
- Average Visit Duration
- Bounce Rate
- % of New Visitors
Each of these will be discussed in more detail in the next post in this series, so stay tuned!
In addition, the Audience Report provides opportunities to view the following unique reports (these, too, will be discussed in more detail in the next part of the series):
- Demographics
- Interests
- Geo
- Behavior
- Technology
- Mobile
- Custom
- Visitors Flow
Acquisition
Within the Acquisition Report area are opportunities to fine-tune the information you are seeking. We will review most of these in the fourth post of this series. The drop-down reports for this section are:
- Overview
- Channels
- All Traffic
- All Referrals
- Campaigns
- Key Words
- Cost Analysis
- AdWords
- Social
- Search Engine Optimization
My favorite report under Acquisition is the “All Traffic” report. Why? Because it allows me, at a quick glance, to analyze from where my traffic is coming.
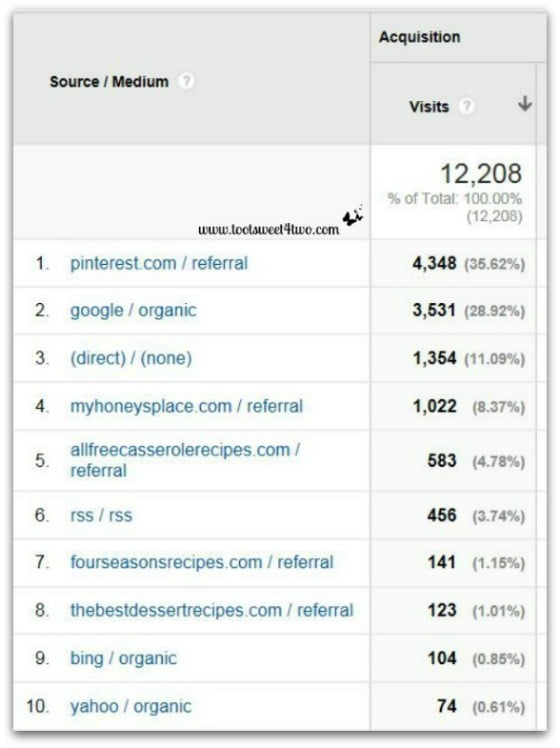
For example, in the photo above, I can see that the majority of my traffic is coming from Pinterest. But, “Google Organic” is close behind. This means that visitors are landing on my site as a result of a “long tail search.”
A long tail search is what most people do now when they type something into the search bar of a search engine. For example, typing in “cake” will yield 152,000,000 results, while typing in “peach pineapple dump cake” produces 172,000 results. And, Toot Sweet 4 Two lands in the top 6 of that search!
Interestingly, if you type in “peach pineapple dump cake recipe”, the results are 3,900,000. But, Toot Sweet 4 Two still lands in the top 6.
Having your Google Organic search engine results in the top level of your traffic reports is a “good thing” because that means you are using SEO (search engine optimization) correctly on your blog.
In the number 3 position on this report are the words “(direct) / (none)”. This means that visitors are typing in our URL (website address) directly! They are choosing to visit us directly!
Behavior
The drop-down categories under the Behavior Report are equally robust. Again, we will cover more details about this report in a future post in this series. In the meantime, Behavior Reports include the following:
- Overview
- Behavior Flow
- Site Content
- Site Speed
- Events
- AdSense
- Experiments
- In-Page Analytics
Here’s a photo of one of my favorite parts of the Behavior Report (Site Content – All Pages):
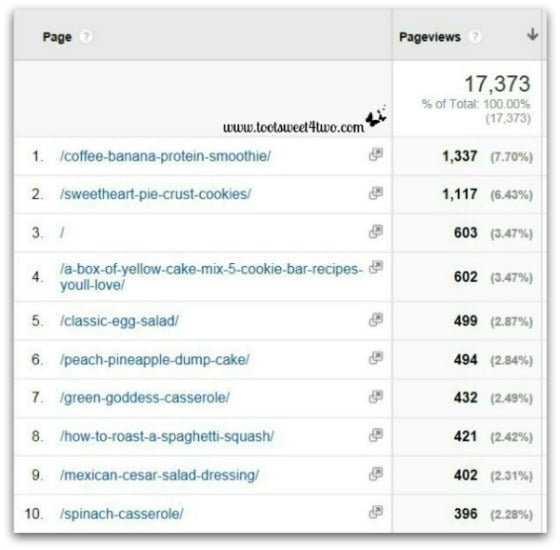
Why is this my favorite view? Because it specifically tells me what people are reading when they land on our site. As you can see by my snippet of this report, nine out of the top ten are recipes (I can’t explain why number 3 is blank! Sorry, but I’ve got much to learn about Google Analytics myself!).
Thanks for investing the time to learn more about what Google Analytics can do for you as a blogger! Now that you’ve peeked into Google Analytics’ reports, be sure to join me for the rest of the series coming up in the days ahead…
- Google Analytics: Analyzing and Understanding the Audience Report
- Google Analytics: Analyzing and Understanding the Acquisition Report
- Google Analytics: Analyzing and Understanding the Behavior Report
And, the first one in the series – Google Analytics: The Basics.
Tootles,

Related Posts:
(other posts about blogging)
- 2 Girls with an Idea
- 3 Cheap and Easy Ideas for Better Food Photography
- 10 Ways to Improve Your Blog’s Design
- 17 Girls and a Baby
- 1000 Hats
- Bloggy Boot Camp Revealed
- Breaking the Rules
- Here Comes Peter Cottontai – A PicMonkey Tutorial
- How Did You Do That? A PicMonkey Halloween Tutorial
- How to Add a Featured Image Thumbnail to a WP Post
- How to Make a Horizontal Photo a Pinterest-Friendly Vertical Photo in PicMonkey
- Millennial Blogs: An Interview with Chelsea Day
- New Year, New View
- Nothing Ventured, Nothing Gained
- Really? Seriously? Are You Frickin’ Kidding Me?
- Someday I’ll Learn
- The Conference Hangover
- The Red Plate Goes to Julie Washington
- Top 10 Reasons Why I Love Bloggy Boot Camp
- Under Construction
Leave a Reply